Web Dashboard
The dashboard runs on port 8080 by default. Change it with CLAUDEOPS_DASHBOARD_PORT — see Configuration for all options.
The web dashboard provides real-time visibility into Claude Ops activity.
TL;DR
The TL;DR page shows an LLM-generated summary of the latest session — key findings and actions at a glance. When a session completes, a fast model (Haiku by default) summarizes the full response into 2–4 sentences. If no summary is available, the page falls back to showing the full session response.
Sessions
Full history of scheduled and manual runs. Each session shows:
- Tier: Which model tier handled the session (Haiku, Sonnet, Opus)
- Model: The specific model used
- Duration: How long the session ran
- Cost: Token cost for the session
- Status: Success, failure, or in-progress
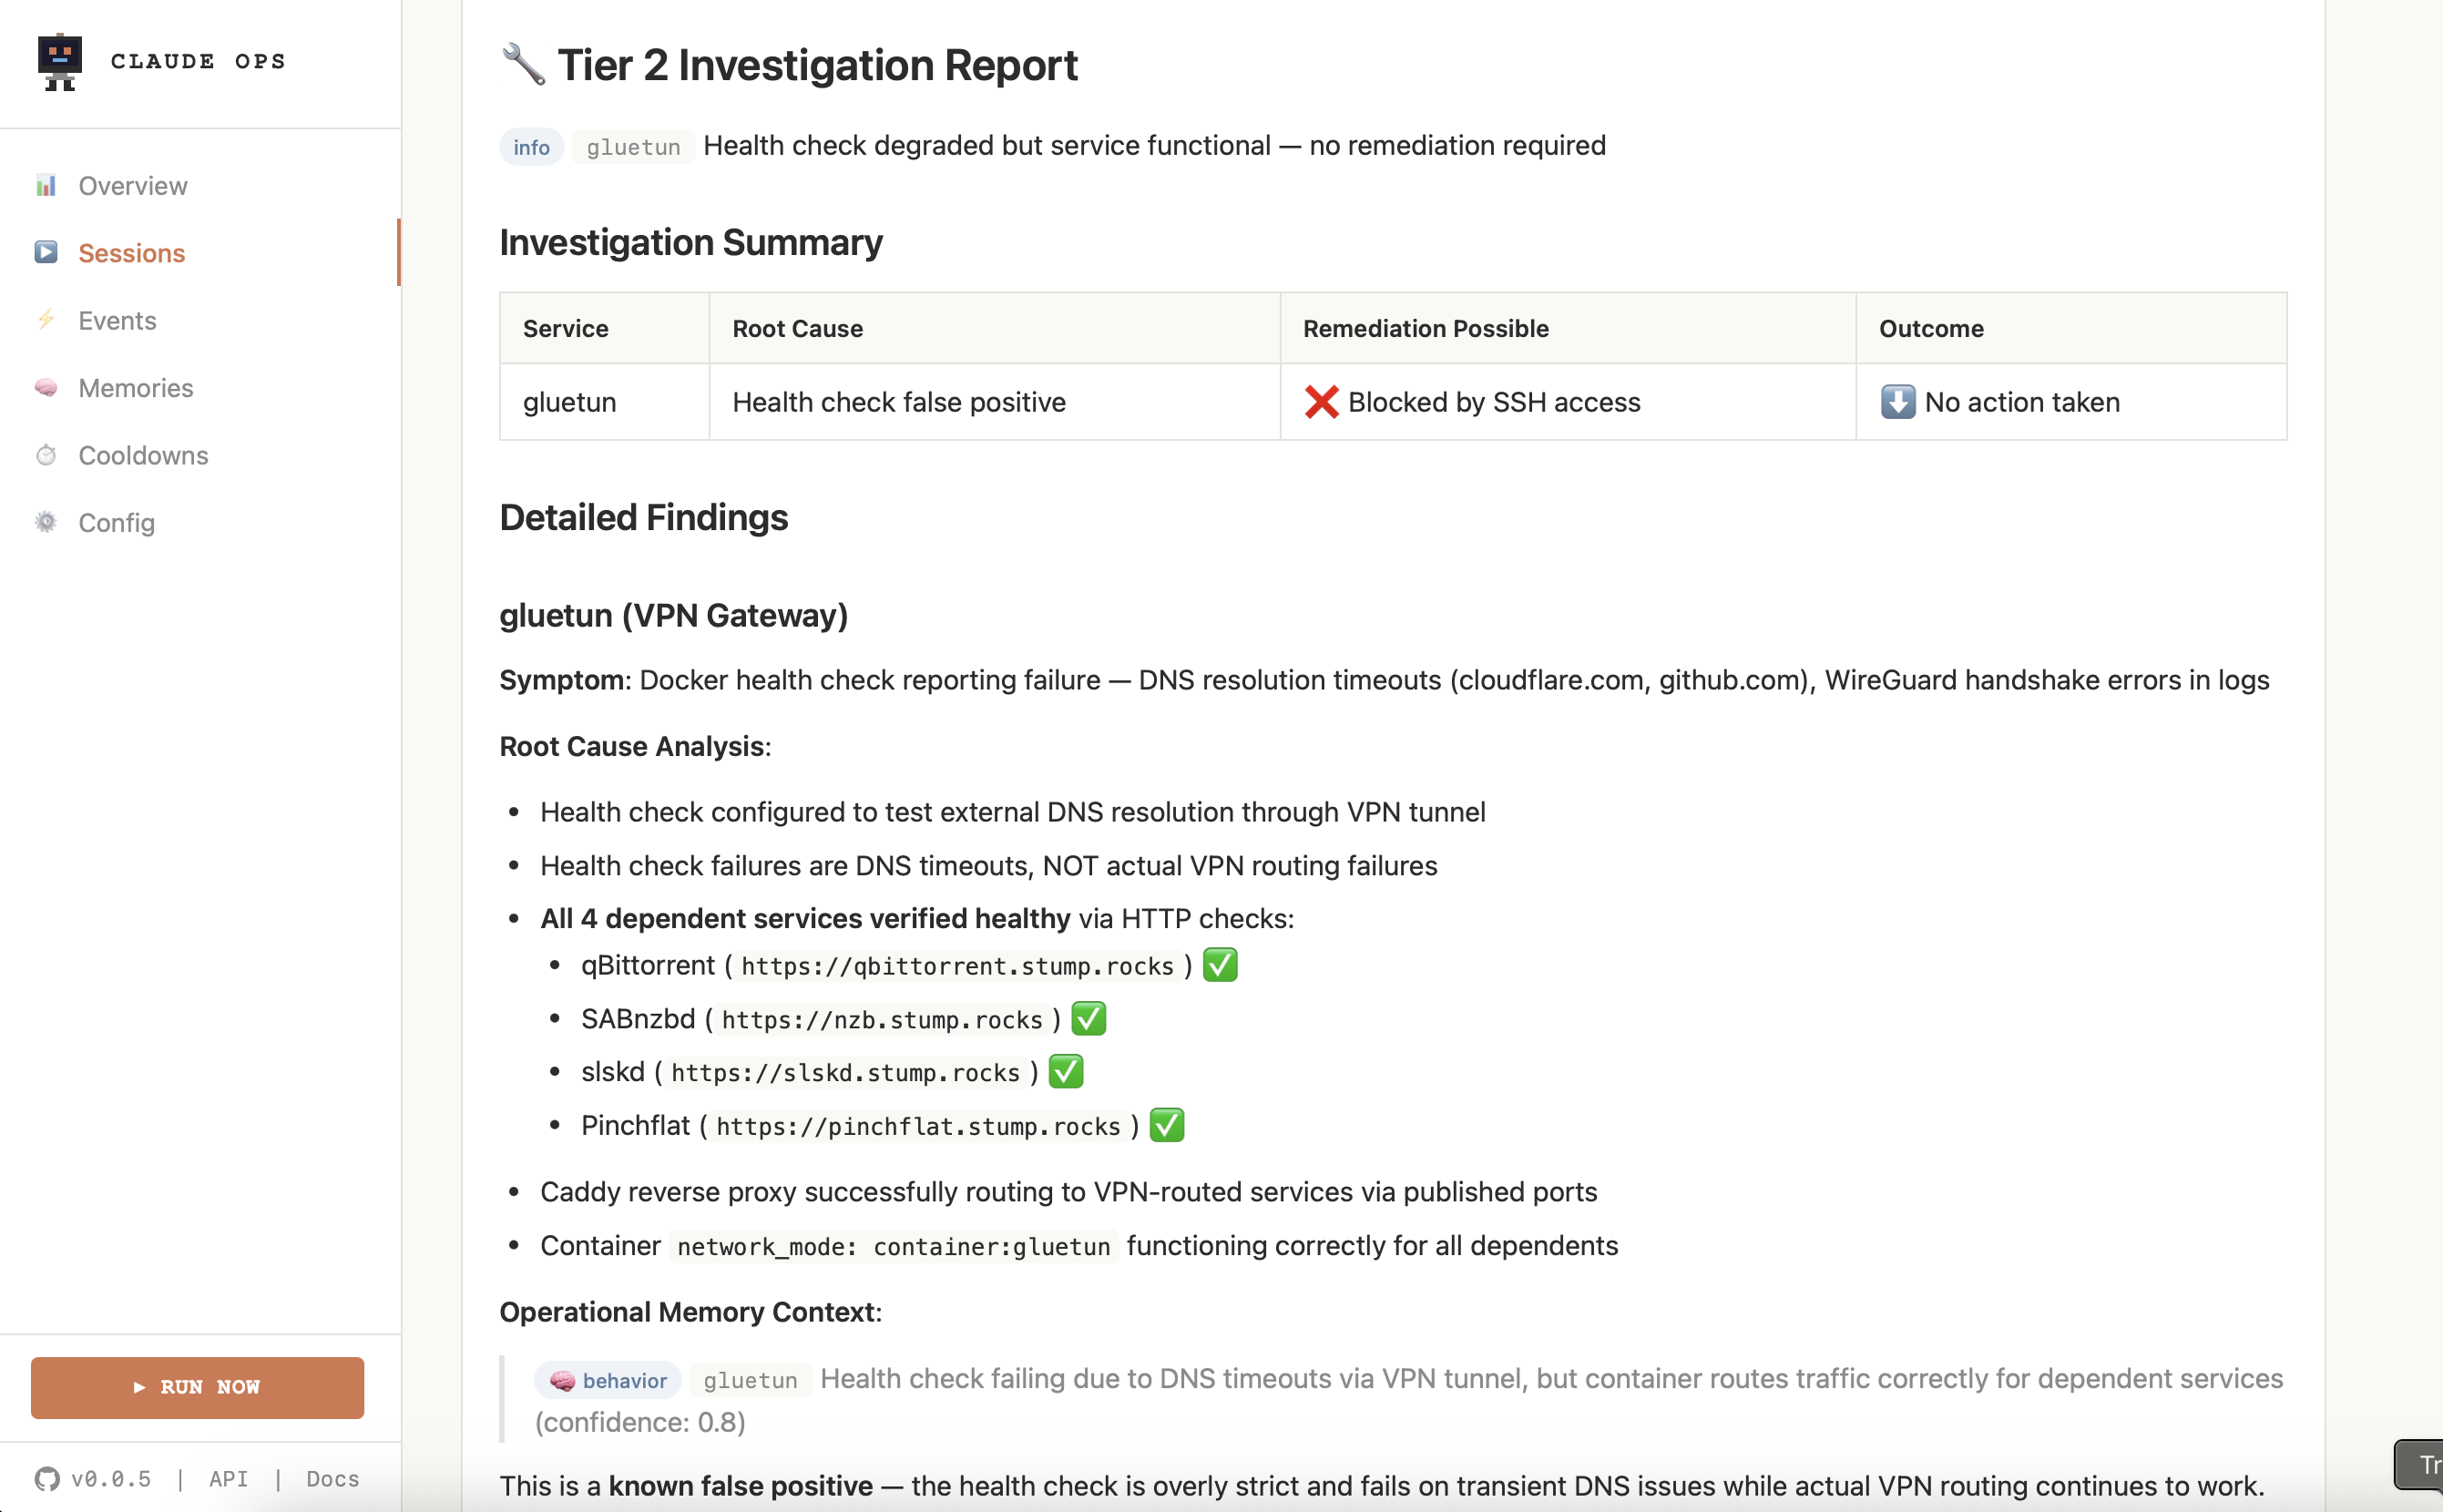
Session detail
Click any session to see its full output. The detail view streams Claude's CLI output in real-time via Server-Sent Events (SSE) — you can watch Claude work as it happens.
When viewing a running session, the output auto-scrolls to follow new content. Scroll up to pause following, or click the follow button to resume.
Manual triggers
Click the Run Now button to kick off an ad-hoc session without waiting for the next scheduled interval.
Events
Service state changes, remediation actions, and escalation decisions. Events are tagged by type:
- Health check results (pass/fail)
- Remediation actions taken (restart, redeploy, etc.)
- Escalation decisions (Tier 1 → 2, Tier 2 → 3)
- Notifications sent
Cooldowns
Current cooldown state and remediation action history per service. Shows:
- How many restarts remain in the current 4-hour window
- Whether a redeployment has been used in the current 24-hour window
- When cooldowns reset
Cooldown limits are max 2 restarts per service per 4 hours and max 1 redeployment per service per 24 hours. When exceeded, Claude sends a "needs human attention" notification instead of retrying.
Memories
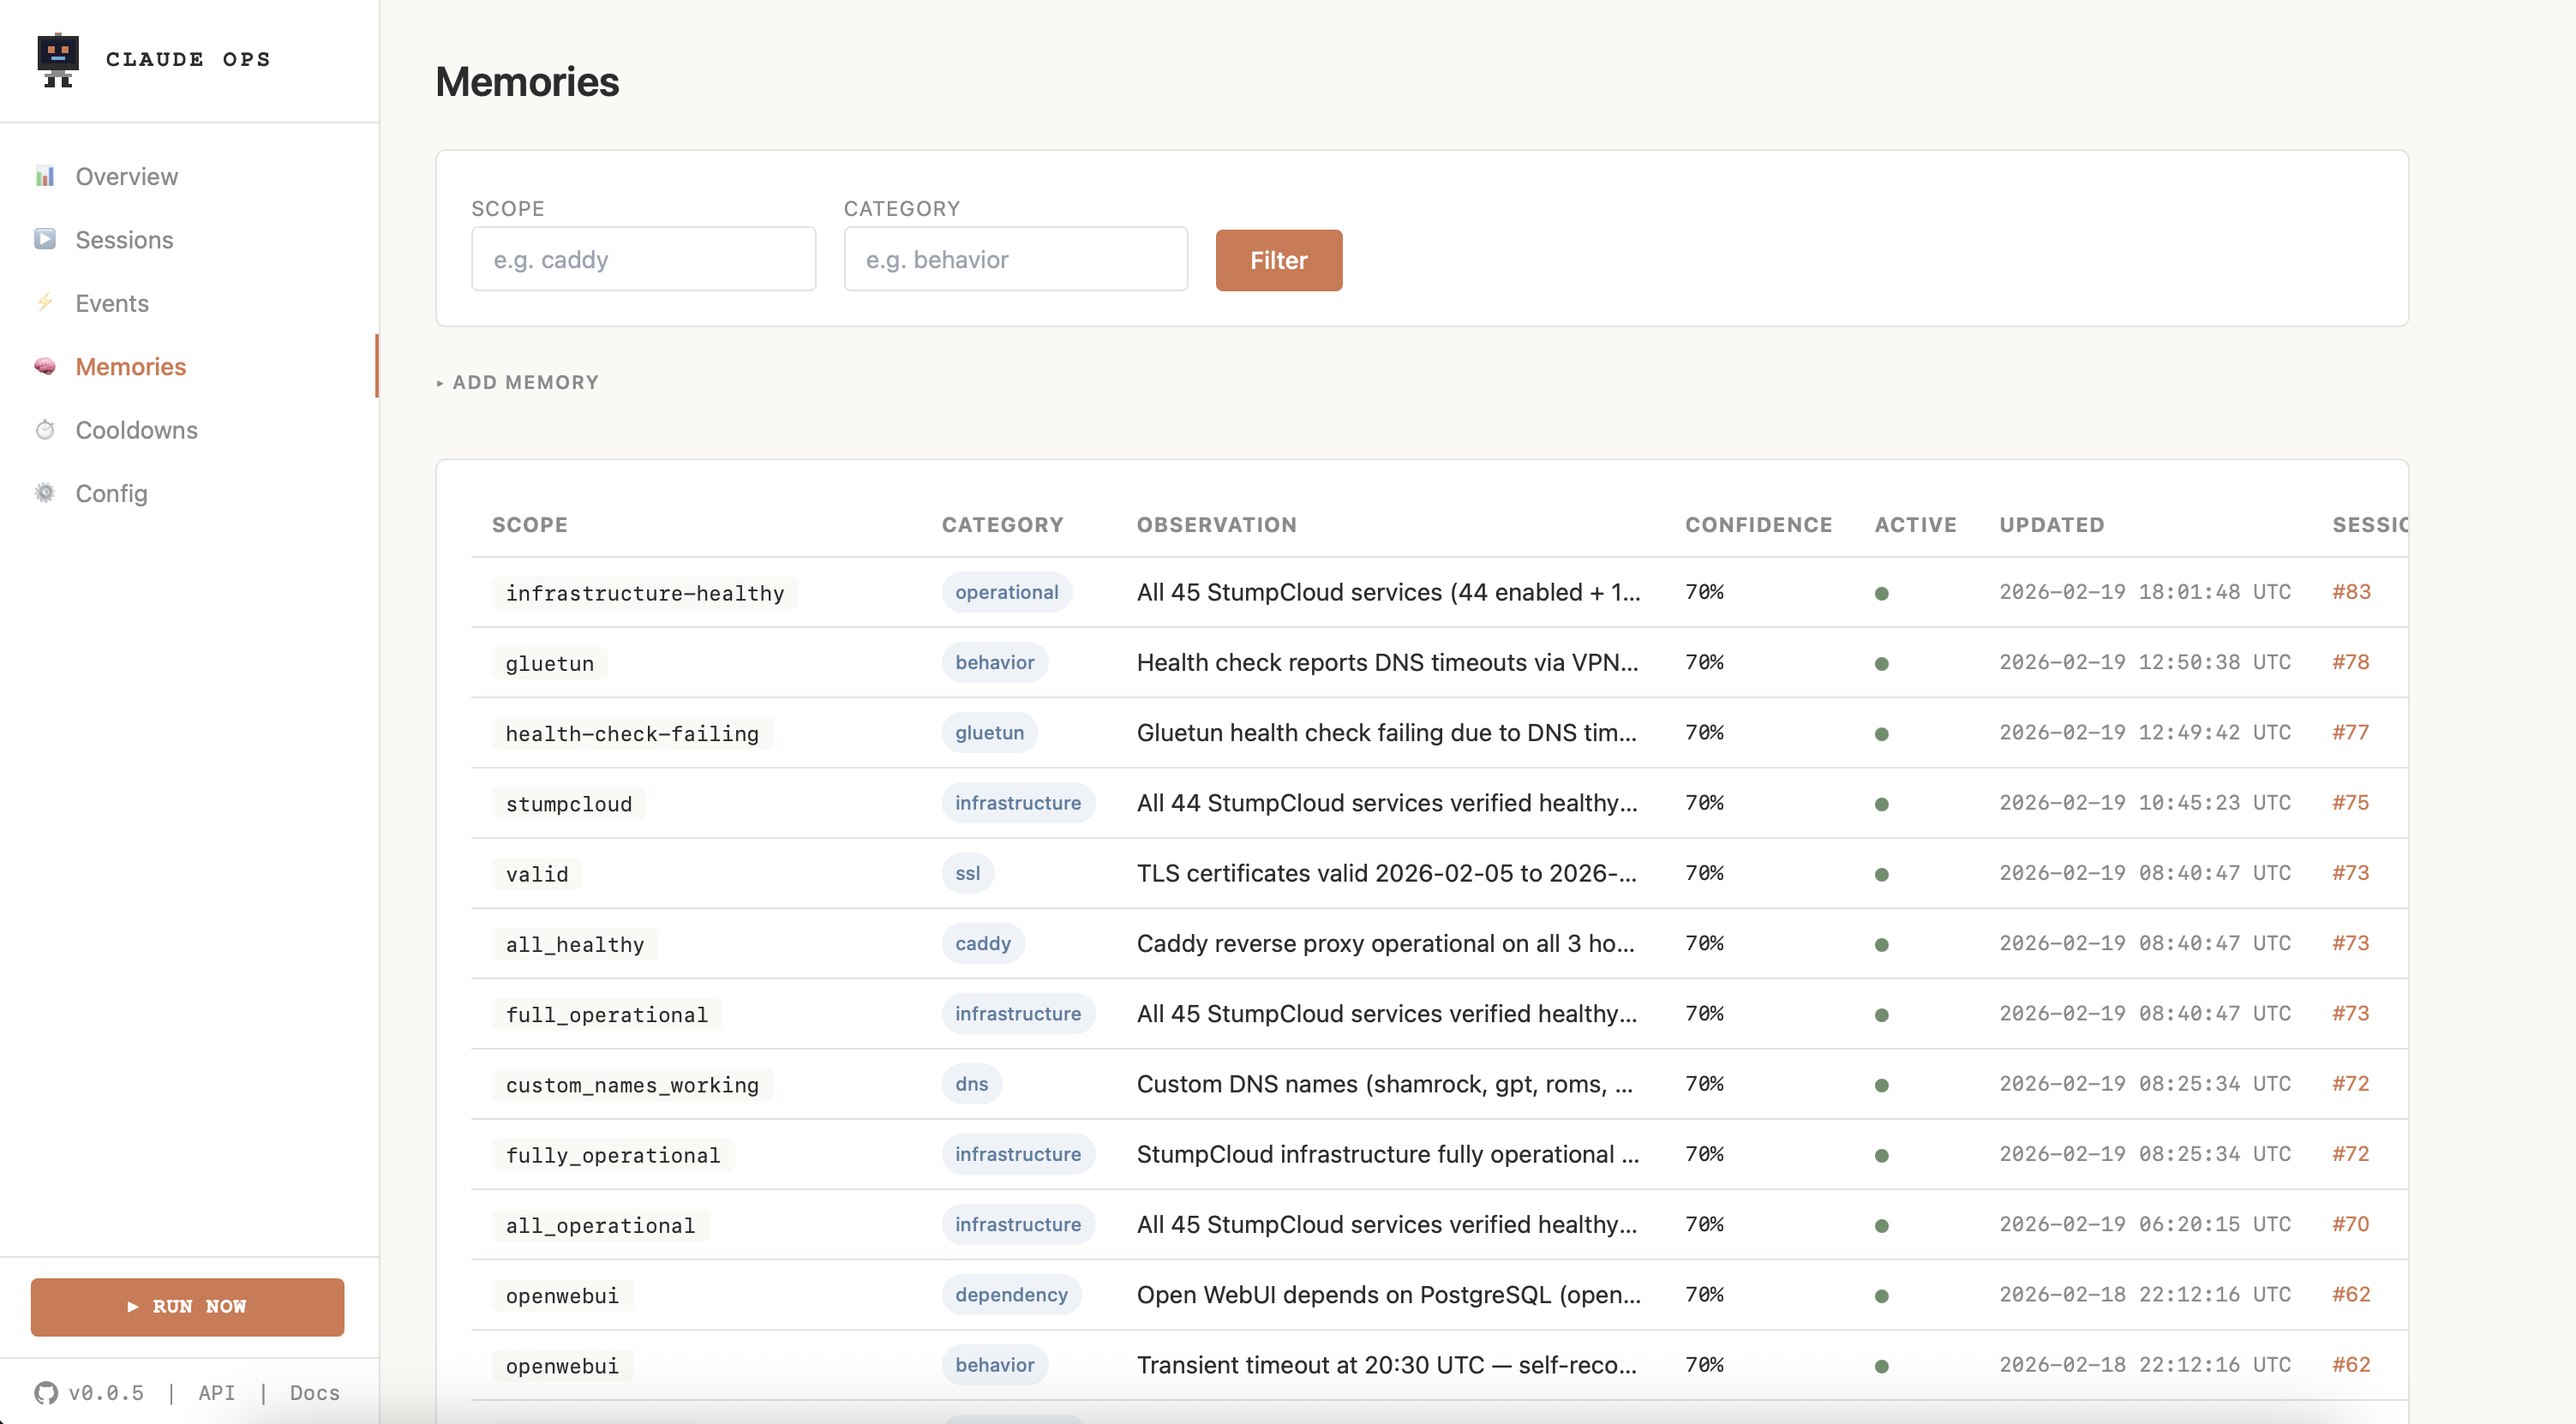
Persistent operational knowledge that the agent learns across sessions. Memories are categorized by type (timing, dependency, behavior, remediation, maintenance) and scoped to specific services or global. Confidence scores decay over time if not reinforced — stale memories are automatically deactivated.
Config
Active configuration and environment variable values. Useful for verifying that your settings are applied correctly. Sensitive values (API keys) are redacted.